Introduction

We will use a random intercept cross-lagged panel model (RI-CLPM) to investigate family relations and their relationship with youth behavioral and emotional problems & brain development, using the prospective, longitudinal Adolescent Brain Cognitive Development study (ABCD, N ≈ 12.000).


Analysis

In this script,

  1. we conducted an RI-CLPM for family conflict.

  2. we conduct two additional RI-CLPMs:

  1. Lastly, we constrain the lagged parameters that were significant in the RI-CLPM for family conflict.

All measures will be assessed at baseline/six-month follow-up, one-year follow-up and three/four-year follow-up in the ABCD study.

Adversity

Brain connectivity

Youth problems

Resilience


Code Legend

1,2,3 = corresponding time point (time point 1,….)

b = brain (white matter connectivity)

Sa = Neighbourhood Safety

m = youth mental problems (behavioral and emotional problems)


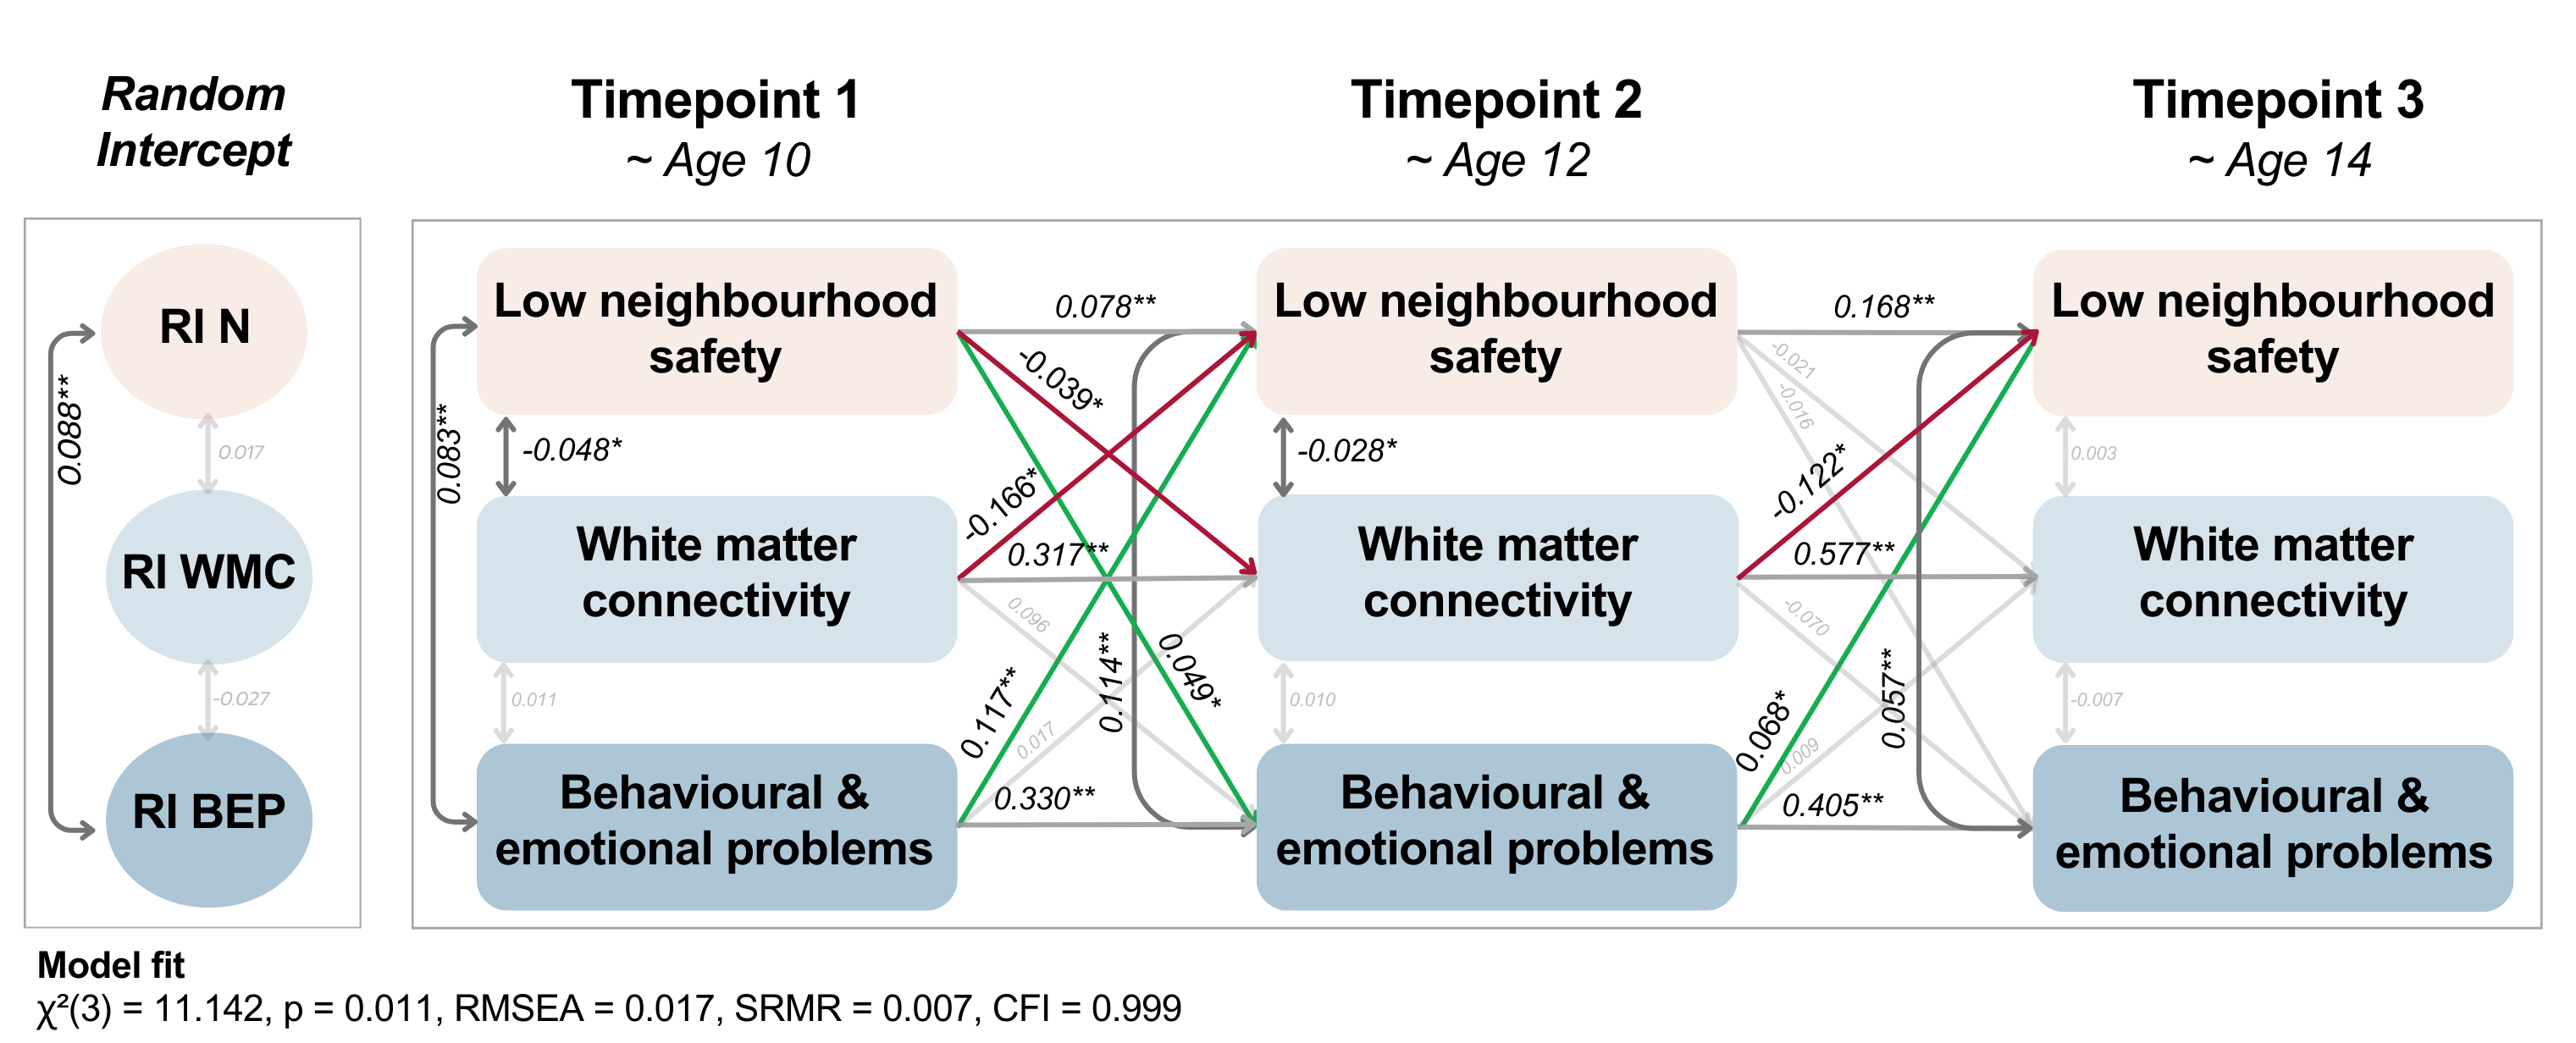
Neighbourhood safety - Main Model

Neighbourhood safety x brain connectivity x youth problems

RICLPM_Safety <- '
# Create between components (random intercepts)
RIx =~ 1*a1Sa + 1*a2Sa + 1*a3Sa
RIy =~ 1*b1 + 1*b2 + 1*b3
RIz =~ 1*m1 + 1*m2 + 1*m3

# Create within-person centered variables
wx1 =~ 1*a1Sa
wx2 =~ 1*a2Sa
wx3 =~ 1*a3Sa
wy1 =~ 1*b1
wy2 =~ 1*b2
wy3 =~ 1*b3
wz1 =~ 1*m1
wz2 =~ 1*m2
wz3 =~ 1*m3

# Estimate lagged effects between within-person centered variables
wx2 + wy2 + wz2 ~ wx1 + wy1 + wz1
wx3 + wy3 + wz3 ~ wx2 + wy2 + wz2

# Estimate covariance between within-person centered variables at first wave
wx1 ~~ wy1 # Covariance
wx1 ~~ wz1
wy1 ~~ wz1

# Estimate covariances between residuals of within-person centered variables 
# (i.e., innovations)
wx2 ~~ wy2
wx2 ~~ wz2
wy2 ~~ wz2
wx3 ~~ wy3
wx3 ~~ wz3
wy3 ~~ wz3

# Estimate variance and covariance of random intercepts
RIx ~~ RIx
RIy ~~ RIy
RIz ~~ RIz
RIx ~~ RIy
RIx ~~ RIz
RIy ~~ RIz

# Estimate (residual) variance of within-person centered variables
wx1 ~~ wx1 # Variances
wy1 ~~ wy1
wz1 ~~ wz1
wx2 ~~ wx2 # Residual variances
wy2 ~~ wy2
wz2 ~~ wz2
wx3 ~~ wx3
wy3 ~~ wy3
wz3 ~~ wz3
'

RICLPM_Safety_fit <- lavaan::lavaan(RICLPM_Safety,
                                    data = Data,
                                    missing = "fiml",
                                    meanstructure = TRUE, 
                                    int.ov.free = TRUE
)

summary(RICLPM_Safety_fit, standardized = TRUE)
## lavaan 0.6.16 ended normally after 94 iterations
## 
##   Estimator                                         ML
##   Optimization method                           NLMINB
##   Number of model parameters                        51
## 
##                                                   Used       Total
##   Number of observations                          9493        9495
##   Number of missing patterns                        70            
## 
## Model Test User Model:
##                                                       
##   Test statistic                                11.142
##   Degrees of freedom                                 3
##   P-value (Chi-square)                           0.011
## 
## Parameter Estimates:
## 
##   Standard errors                             Standard
##   Information                                 Observed
##   Observed information based on                Hessian
## 
## Latent Variables:
##                    Estimate  Std.Err  z-value  P(>|z|)   Std.lv  Std.all
##   RIx =~                                                                
##     a1Sa              1.000                               0.479    0.481
##     a2Sa              1.000                               0.479    0.479
##     a3Sa              1.000                               0.479    0.481
##   RIy =~                                                                
##     b1                1.000                               0.866    0.864
##     b2                1.000                               0.866    0.854
##     b3                1.000                               0.866    0.840
##   RIz =~                                                                
##     m1                1.000                               0.498    0.501
##     m2                1.000                               0.498    0.497
##     m3                1.000                               0.498    0.497
##   wx1 =~                                                                
##     a1Sa              1.000                               0.874    0.877
##   wx2 =~                                                                
##     a2Sa              1.000                               0.879    0.878
##   wx3 =~                                                                
##     a3Sa              1.000                               0.873    0.877
##   wy1 =~                                                                
##     b1                1.000                               0.505    0.504
##   wy2 =~                                                                
##     b2                1.000                               0.528    0.521
##   wy3 =~                                                                
##     b3                1.000                               0.558    0.542
##   wz1 =~                                                                
##     m1                1.000                               0.860    0.866
##   wz2 =~                                                                
##     m2                1.000                               0.870    0.868
##   wz3 =~                                                                
##     m3                1.000                               0.868    0.867
## 
## Regressions:
##                    Estimate  Std.Err  z-value  P(>|z|)   Std.lv  Std.all
##   wx2 ~                                                                 
##     wx1               0.078    0.027    2.924    0.003    0.078    0.078
##     wy1              -0.166    0.073   -2.261    0.024   -0.095   -0.095
##     wz1               0.117    0.025    4.602    0.000    0.115    0.115
##   wy2 ~                                                                 
##     wx1              -0.039    0.019   -2.046    0.041   -0.064   -0.064
##     wy1               0.317    0.093    3.400    0.001    0.303    0.303
##     wz1               0.017    0.023    0.737    0.461    0.028    0.028
##   wz2 ~                                                                 
##     wx1               0.049    0.020    2.441    0.015    0.050    0.050
##     wy1               0.096    0.072    1.346    0.178    0.056    0.056
##     wz1               0.330    0.031   10.487    0.000    0.327    0.327
##   wx3 ~                                                                 
##     wx2               0.168    0.027    6.329    0.000    0.169    0.169
##     wy2              -0.122    0.052   -2.358    0.018   -0.074   -0.074
##     wz2               0.068    0.027    2.515    0.012    0.067    0.067
##   wy3 ~                                                                 
##     wx2              -0.021    0.017   -1.261    0.207   -0.034   -0.034
##     wy2               0.577    0.041   14.228    0.000    0.546    0.546
##     wz2               0.009    0.019    0.480    0.631    0.014    0.014
##   wz3 ~                                                                 
##     wx2              -0.016    0.022   -0.752    0.452   -0.016   -0.016
##     wy2              -0.070    0.048   -1.454    0.146   -0.042   -0.042
##     wz2               0.405    0.029   13.868    0.000    0.405    0.405
## 
## Covariances:
##                    Estimate  Std.Err  z-value  P(>|z|)   Std.lv  Std.all
##   wx1 ~~                                                                
##     wy1              -0.048    0.020   -2.430    0.015   -0.108   -0.108
##     wz1               0.083    0.021    4.042    0.000    0.111    0.111
##   wy1 ~~                                                                
##     wz1               0.011    0.023    0.467    0.640    0.025    0.025
##  .wx2 ~~                                                                
##    .wy2              -0.028    0.014   -2.010    0.044   -0.065   -0.065
##    .wz2               0.114    0.015    7.795    0.000    0.161    0.161
##  .wy2 ~~                                                                
##    .wz2               0.010    0.014    0.769    0.442    0.025    0.025
##  .wx3 ~~                                                                
##    .wy3               0.003    0.011    0.299    0.765    0.008    0.008
##    .wz3               0.057    0.014    3.990    0.000    0.083    0.083
##  .wy3 ~~                                                                
##    .wz3              -0.007    0.010   -0.742    0.458   -0.019   -0.019
##   RIx ~~                                                                
##     RIy               0.017    0.019    0.914    0.361    0.042    0.042
##     RIz               0.088    0.019    4.573    0.000    0.370    0.370
##   RIy ~~                                                                
##     RIz              -0.027    0.023   -1.186    0.235   -0.062   -0.062
## 
## Intercepts:
##                    Estimate  Std.Err  z-value  P(>|z|)   Std.lv  Std.all
##    .a1Sa             -0.001    0.010   -0.058    0.953   -0.001   -0.001
##    .a2Sa              0.004    0.011    0.338    0.735    0.004    0.004
##    .a3Sa              0.010    0.015    0.626    0.531    0.010    0.010
##    .b1               -0.010    0.011   -0.921    0.357   -0.010   -0.010
##    .b2               -0.026    0.012   -2.239    0.025   -0.026   -0.026
##    .b3               -0.055    0.015   -3.703    0.000   -0.055   -0.053
##    .m1                0.001    0.010    0.055    0.956    0.001    0.001
##    .m2                0.006    0.011    0.602    0.547    0.006    0.006
##    .m3                0.022    0.015    1.455    0.146    0.022    0.022
##     RIx               0.000                               0.000    0.000
##     RIy               0.000                               0.000    0.000
##     RIz               0.000                               0.000    0.000
##     wx1               0.000                               0.000    0.000
##    .wx2               0.000                               0.000    0.000
##    .wx3               0.000                               0.000    0.000
##     wy1               0.000                               0.000    0.000
##    .wy2               0.000                               0.000    0.000
##    .wy3               0.000                               0.000    0.000
##     wz1               0.000                               0.000    0.000
##    .wz2               0.000                               0.000    0.000
##    .wz3               0.000                               0.000    0.000
## 
## Variances:
##                    Estimate  Std.Err  z-value  P(>|z|)   Std.lv  Std.all
##     RIx               0.230    0.022   10.596    0.000    1.000    1.000
##     RIy               0.750    0.034   21.745    0.000    1.000    1.000
##     RIz               0.248    0.032    7.644    0.000    1.000    1.000
##     wx1               0.763    0.024   31.870    0.000    1.000    1.000
##     wy1               0.255    0.032    7.871    0.000    1.000    1.000
##     wz1               0.740    0.034   21.967    0.000    1.000    1.000
##    .wx2               0.748    0.022   34.190    0.000    0.969    0.969
##    .wy2               0.251    0.019   13.439    0.000    0.899    0.899
##    .wz2               0.668    0.019   35.239    0.000    0.884    0.884
##    .wx3               0.728    0.021   34.066    0.000    0.955    0.955
##    .wy3               0.217    0.009   24.614    0.000    0.696    0.696
##    .wz3               0.632    0.019   34.108    0.000    0.838    0.838
##    .a1Sa              0.000                               0.000    0.000
##    .a2Sa              0.000                               0.000    0.000
##    .a3Sa              0.000                               0.000    0.000
##    .b1                0.000                               0.000    0.000
##    .b2                0.000                               0.000    0.000
##    .b3                0.000                               0.000    0.000
##    .m1                0.000                               0.000    0.000
##    .m2                0.000                               0.000    0.000
##    .m3                0.000                               0.000    0.000
fitMeasures(RICLPM_Safety_fit, fit.measures = c("chisq","df","pvalue","rmsea","srmr","cfi"))
##  chisq     df pvalue  rmsea   srmr    cfi 
## 11.142  3.000  0.011  0.017  0.007  0.999

Multigroup analysis

Neighbourhood safety & Peer resilience

RICLPM_Safety_fit_Peers <- lavaan::lavaan(RICLPM_Safety,
                             data = Data,
                             missing = "fiml",
                             meanstructure = TRUE, 
                             int.ov.free = TRUE,
                             group = "Resilience_Peers"
)

summary(RICLPM_Safety_fit_Peers, standardized = TRUE)
## lavaan 0.6.16 ended normally after 198 iterations
## 
##   Estimator                                         ML
##   Optimization method                           NLMINB
##   Number of model parameters                       102
## 
##   Number of observations per group:                   
##     1                                             4407
##     0                                             5070
##   Number of missing patterns per group:               
##     1                                               58
##     0                                               54
## 
## Model Test User Model:
##                                                       
##   Test statistic                                15.217
##   Degrees of freedom                                 6
##   P-value (Chi-square)                           0.019
##   Test statistic for each group:
##     1                                           10.471
##     0                                            4.747
## 
## Parameter Estimates:
## 
##   Standard errors                             Standard
##   Information                                 Observed
##   Observed information based on                Hessian
## 
## 
## Group 1 [1]:
## 
## Latent Variables:
##                    Estimate  Std.Err  z-value  P(>|z|)   Std.lv  Std.all
##   RIx =~                                                                
##     a1Sa              1.000                               0.459    0.465
##     a2Sa              1.000                               0.459    0.460
##     a3Sa              1.000                               0.459    0.463
##   RIy =~                                                                
##     b1                1.000                               0.879    0.886
##     b2                1.000                               0.879    0.884
##     b3                1.000                               0.879    0.873
##   RIz =~                                                                
##     m1                1.000                               0.467    0.471
##     m2                1.000                               0.467    0.461
##     m3                1.000                               0.467    0.471
##   wx1 =~                                                                
##     a1Sa              1.000                               0.874    0.885
##   wx2 =~                                                                
##     a2Sa              1.000                               0.887    0.888
##   wx3 =~                                                                
##     a3Sa              1.000                               0.880    0.886
##   wy1 =~                                                                
##     b1                1.000                               0.461    0.464
##   wy2 =~                                                                
##     b2                1.000                               0.464    0.467
##   wy3 =~                                                                
##     b3                1.000                               0.491    0.487
##   wz1 =~                                                                
##     m1                1.000                               0.876    0.882
##   wz2 =~                                                                
##     m2                1.000                               0.900    0.888
##   wz3 =~                                                                
##     m3                1.000                               0.874    0.882
## 
## Regressions:
##                    Estimate  Std.Err  z-value  P(>|z|)   Std.lv  Std.all
##   wx2 ~                                                                 
##     wx1               0.103    0.039    2.622    0.009    0.102    0.102
##     wy1              -0.134    0.117   -1.145    0.252   -0.070   -0.070
##     wz1               0.201    0.037    5.453    0.000    0.198    0.198
##   wy2 ~                                                                 
##     wx1              -0.045    0.031   -1.460    0.144   -0.085   -0.085
##     wy1               0.091    0.154    0.594    0.552    0.091    0.091
##     wz1               0.061    0.038    1.598    0.110    0.116    0.116
##   wz2 ~                                                                 
##     wx1               0.093    0.031    3.022    0.003    0.090    0.090
##     wy1               0.238    0.119    1.999    0.046    0.122    0.122
##     wz1               0.347    0.047    7.463    0.000    0.338    0.338
##   wx3 ~                                                                 
##     wx2               0.169    0.039    4.345    0.000    0.171    0.171
##     wy2              -0.039    0.080   -0.483    0.629   -0.020   -0.020
##     wz2               0.114    0.038    3.014    0.003    0.117    0.117
##   wy3 ~                                                                 
##     wx2              -0.007    0.025   -0.277    0.782   -0.012   -0.012
##     wy2               0.469    0.061    7.715    0.000    0.443    0.443
##     wz2               0.025    0.028    0.889    0.374    0.045    0.045
##   wz3 ~                                                                 
##     wx2              -0.007    0.031   -0.208    0.835   -0.007   -0.007
##     wy2              -0.079    0.073   -1.083    0.279   -0.042   -0.042
##     wz2               0.417    0.040   10.351    0.000    0.429    0.429
## 
## Covariances:
##                    Estimate  Std.Err  z-value  P(>|z|)   Std.lv  Std.all
##   wx1 ~~                                                                
##     wy1              -0.038    0.024   -1.580    0.114   -0.094   -0.094
##     wz1               0.142    0.032    4.453    0.000    0.185    0.185
##   wy1 ~~                                                                
##     wz1               0.039    0.029    1.332    0.183    0.097    0.097
##  .wx2 ~~                                                                
##    .wy2              -0.029    0.023   -1.261    0.207   -0.074   -0.074
##    .wz2               0.159    0.021    7.519    0.000    0.223    0.223
##  .wy2 ~~                                                                
##    .wz2               0.038    0.023    1.639    0.101    0.102    0.102
##  .wx3 ~~                                                                
##    .wy3               0.033    0.015    2.204    0.028    0.088    0.088
##    .wz3               0.092    0.021    4.408    0.000    0.136    0.136
##  .wy3 ~~                                                                
##    .wz3              -0.015    0.013   -1.141    0.254   -0.043   -0.043
##   RIx ~~                                                                
##     RIy              -0.002    0.024   -0.070    0.944   -0.004   -0.004
##     RIz               0.033    0.030    1.089    0.276    0.152    0.152
##   RIy ~~                                                                
##     RIz              -0.061    0.029   -2.099    0.036   -0.149   -0.149
## 
## Intercepts:
##                    Estimate  Std.Err  z-value  P(>|z|)   Std.lv  Std.all
##    .a1Sa             -0.028    0.015   -1.889    0.059   -0.028   -0.028
##    .a2Sa             -0.030    0.016   -1.958    0.050   -0.030   -0.031
##    .a3Sa             -0.024    0.023   -1.068    0.286   -0.024   -0.024
##    .b1                0.018    0.016    1.115    0.265    0.018    0.018
##    .b2                0.020    0.017    1.206    0.228    0.020    0.020
##    .b3               -0.015    0.021   -0.717    0.473   -0.015   -0.015
##    .m1               -0.017    0.015   -1.120    0.263   -0.017   -0.017
##    .m2                0.004    0.016    0.268    0.789    0.004    0.004
##    .m3                0.007    0.022    0.310    0.757    0.007    0.007
##     RIx               0.000                               0.000    0.000
##     RIy               0.000                               0.000    0.000
##     RIz               0.000                               0.000    0.000
##     wx1               0.000                               0.000    0.000
##    .wx2               0.000                               0.000    0.000
##    .wx3               0.000                               0.000    0.000
##     wy1               0.000                               0.000    0.000
##    .wy2               0.000                               0.000    0.000
##    .wy3               0.000                               0.000    0.000
##     wz1               0.000                               0.000    0.000
##    .wz2               0.000                               0.000    0.000
##    .wz3               0.000                               0.000    0.000
## 
## Variances:
##                    Estimate  Std.Err  z-value  P(>|z|)   Std.lv  Std.all
##     RIx               0.211    0.033    6.477    0.000    1.000    1.000
##     RIy               0.773    0.038   20.541    0.000    1.000    1.000
##     RIz               0.218    0.049    4.470    0.000    1.000    1.000
##     wx1               0.763    0.036   21.333    0.000    1.000    1.000
##     wy1               0.212    0.034    6.264    0.000    1.000    1.000
##     wz1               0.767    0.051   14.986    0.000    1.000    1.000
##    .wx2               0.739    0.031   24.155    0.000    0.939    0.939
##    .wy2               0.209    0.033    6.309    0.000    0.971    0.971
##    .wz2               0.686    0.029   24.057    0.000    0.846    0.846
##    .wx3               0.732    0.032   23.185    0.000    0.946    0.946
##    .wy3               0.192    0.013   15.275    0.000    0.795    0.795
##    .wz3               0.627    0.027   23.278    0.000    0.820    0.820
##    .a1Sa              0.000                               0.000    0.000
##    .a2Sa              0.000                               0.000    0.000
##    .a3Sa              0.000                               0.000    0.000
##    .b1                0.000                               0.000    0.000
##    .b2                0.000                               0.000    0.000
##    .b3                0.000                               0.000    0.000
##    .m1                0.000                               0.000    0.000
##    .m2                0.000                               0.000    0.000
##    .m3                0.000                               0.000    0.000
## 
## 
## Group 2 [0]:
## 
## Latent Variables:
##                    Estimate  Std.Err  z-value  P(>|z|)   Std.lv  Std.all
##   RIx =~                                                                
##     a1Sa              1.000                               0.483    0.482
##     a2Sa              1.000                               0.483    0.482
##     a3Sa              1.000                               0.483    0.484
##   RIy =~                                                                
##     b1                1.000                               0.833    0.825
##     b2                1.000                               0.833    0.810
##     b3                1.000                               0.833    0.794
##   RIz =~                                                                
##     m1                1.000                               0.512    0.515
##     m2                1.000                               0.512    0.517
##     m3                1.000                               0.512    0.509
##   wx1 =~                                                                
##     a1Sa              1.000                               0.880    0.876
##   wx2 =~                                                                
##     a2Sa              1.000                               0.878    0.876
##   wx3 =~                                                                
##     a3Sa              1.000                               0.874    0.875
##   wy1 =~                                                                
##     b1                1.000                               0.571    0.566
##   wy2 =~                                                                
##     b2                1.000                               0.603    0.587
##   wy3 =~                                                                
##     b3                1.000                               0.638    0.608
##   wz1 =~                                                                
##     m1                1.000                               0.852    0.857
##   wz2 =~                                                                
##     m2                1.000                               0.849    0.856
##   wz3 =~                                                                
##     m3                1.000                               0.865    0.861
## 
## Regressions:
##                    Estimate  Std.Err  z-value  P(>|z|)   Std.lv  Std.all
##   wx2 ~                                                                 
##     wx1               0.051    0.037    1.384    0.167    0.051    0.051
##     wy1              -0.221    0.092   -2.406    0.016   -0.144   -0.144
##     wz1               0.040    0.036    1.121    0.262    0.039    0.039
##   wy2 ~                                                                 
##     wx1              -0.043    0.024   -1.788    0.074   -0.062   -0.062
##     wy1               0.502    0.109    4.593    0.000    0.476    0.476
##     wz1              -0.005    0.029   -0.158    0.875   -0.006   -0.006
##   wz2 ~                                                                 
##     wx1               0.015    0.028    0.544    0.586    0.016    0.016
##     wy1               0.001    0.087    0.017    0.987    0.001    0.001
##     wz1               0.311    0.044    7.041    0.000    0.312    0.312
##   wx3 ~                                                                 
##     wx2               0.167    0.036    4.587    0.000    0.167    0.167
##     wy2              -0.172    0.070   -2.476    0.013   -0.119   -0.119
##     wz2               0.021    0.038    0.537    0.591    0.020    0.020
##   wy3 ~                                                                 
##     wx2              -0.039    0.024   -1.628    0.104   -0.053   -0.053
##     wy2               0.665    0.056   11.867    0.000    0.628    0.628
##     wz2               0.002    0.027    0.084    0.933    0.003    0.003
##   wz3 ~                                                                 
##     wx2              -0.028    0.030   -0.944    0.345   -0.028   -0.028
##     wy2              -0.059    0.064   -0.927    0.354   -0.041   -0.041
##     wz2               0.398    0.042    9.463    0.000    0.390    0.390
## 
## Covariances:
##                    Estimate  Std.Err  z-value  P(>|z|)   Std.lv  Std.all
##   wx1 ~~                                                                
##     wy1              -0.070    0.035   -2.014    0.044   -0.139   -0.139
##     wz1               0.037    0.028    1.333    0.183    0.050    0.050
##   wy1 ~~                                                                
##     wz1              -0.012    0.037   -0.314    0.754   -0.024   -0.024
##  .wx2 ~~                                                                
##    .wy2              -0.030    0.018   -1.699    0.089   -0.065   -0.065
##    .wz2               0.072    0.021    3.461    0.001    0.103    0.103
##  .wy2 ~~                                                                
##    .wz2              -0.006    0.016   -0.365    0.715   -0.014   -0.014
##  .wx3 ~~                                                                
##    .wy3              -0.019    0.015   -1.285    0.199   -0.046   -0.046
##    .wz3               0.026    0.019    1.343    0.179    0.038    0.038
##  .wy3 ~~                                                                
##    .wz3               0.001    0.014    0.083    0.934    0.003    0.003
##   RIx ~~                                                                
##     RIy               0.048    0.034    1.435    0.151    0.120    0.120
##     RIz               0.130    0.026    4.951    0.000    0.526    0.526
##   RIy ~~                                                                
##     RIz               0.002    0.037    0.065    0.948    0.006    0.006
## 
## Intercepts:
##                    Estimate  Std.Err  z-value  P(>|z|)   Std.lv  Std.all
##    .a1Sa              0.023    0.014    1.630    0.103    0.023    0.023
##    .a2Sa              0.033    0.015    2.259    0.024    0.033    0.033
##    .a3Sa              0.039    0.021    1.846    0.065    0.039    0.039
##    .b1               -0.032    0.015   -2.160    0.031   -0.032   -0.032
##    .b2               -0.063    0.016   -3.940    0.000   -0.063   -0.062
##    .b3               -0.087    0.021   -4.174    0.000   -0.087   -0.083
##    .m1                0.014    0.014    1.018    0.309    0.014    0.015
##    .m2                0.008    0.014    0.535    0.592    0.008    0.008
##    .m3                0.033    0.020    1.611    0.107    0.033    0.033
##     RIx               0.000                               0.000    0.000
##     RIy               0.000                               0.000    0.000
##     RIz               0.000                               0.000    0.000
##     wx1               0.000                               0.000    0.000
##    .wx2               0.000                               0.000    0.000
##    .wx3               0.000                               0.000    0.000
##     wy1               0.000                               0.000    0.000
##    .wy2               0.000                               0.000    0.000
##    .wy3               0.000                               0.000    0.000
##     wz1               0.000                               0.000    0.000
##    .wz2               0.000                               0.000    0.000
##    .wz3               0.000                               0.000    0.000
## 
## Variances:
##                    Estimate  Std.Err  z-value  P(>|z|)   Std.lv  Std.all
##     RIx               0.234    0.031    7.578    0.000    1.000    1.000
##     RIy               0.694    0.069   10.004    0.000    1.000    1.000
##     RIz               0.262    0.044    5.955    0.000    1.000    1.000
##     wx1               0.774    0.034   22.793    0.000    1.000    1.000
##     wy1               0.327    0.067    4.845    0.000    1.000    1.000
##     wz1               0.726    0.045   15.949    0.000    1.000    1.000
##    .wx2               0.749    0.032   23.655    0.000    0.973    0.973
##    .wy2               0.277    0.021   13.469    0.000    0.762    0.762
##    .wz2               0.649    0.026   24.545    0.000    0.902    0.902
##    .wx3               0.727    0.029   24.829    0.000    0.951    0.951
##    .wy3               0.242    0.013   18.758    0.000    0.594    0.594
##    .wz3               0.635    0.025   24.914    0.000    0.848    0.848
##    .a1Sa              0.000                               0.000    0.000
##    .a2Sa              0.000                               0.000    0.000
##    .a3Sa              0.000                               0.000    0.000
##    .b1                0.000                               0.000    0.000
##    .b2                0.000                               0.000    0.000
##    .b3                0.000                               0.000    0.000
##    .m1                0.000                               0.000    0.000
##    .m2                0.000                               0.000    0.000
##    .m3                0.000                               0.000    0.000
fitMeasures(RICLPM_Safety_fit_Peers, fit.measures = c("chisq","df","pvalue","rmsea","srmr","cfi"))
##  chisq     df pvalue  rmsea   srmr    cfi 
## 15.217  6.000  0.019  0.018  0.008  0.999

Neighbourhood safety & Gender

RICLPM_Safety_fit_Sex <- lavaan::lavaan(RICLPM_Safety,
                             data = Data,
                             missing = "fiml",
                             meanstructure = TRUE, 
                             int.ov.free = TRUE,
                             group = "Sex"
)

summary(RICLPM_Safety_fit_Sex, standardized = TRUE)
## lavaan 0.6.16 ended normally after 188 iterations
## 
##   Estimator                                         ML
##   Optimization method                           NLMINB
##   Number of model parameters                       102
## 
##   Number of observations per group:               Used       Total
##     1                                             4953        4953
##     2                                             4522        4524
##   Number of missing patterns per group:                           
##     1                                               63            
##     2                                               52            
## 
## Model Test User Model:
##                                                       
##   Test statistic                                12.365
##   Degrees of freedom                                 6
##   P-value (Chi-square)                           0.054
##   Test statistic for each group:
##     1                                            4.797
##     2                                            7.568
## 
## Parameter Estimates:
## 
##   Standard errors                             Standard
##   Information                                 Observed
##   Observed information based on                Hessian
## 
## 
## Group 1 [1]:
## 
## Latent Variables:
##                    Estimate  Std.Err  z-value  P(>|z|)   Std.lv  Std.all
##   RIx =~                                                                
##     a1Sa              1.000                               0.456    0.450
##     a2Sa              1.000                               0.456    0.451
##     a3Sa              1.000                               0.456    0.464
##   RIy =~                                                                
##     b1                1.000                               0.872    0.868
##     b2                1.000                               0.872    0.852
##     b3                1.000                               0.872    0.826
##   RIz =~                                                                
##     m1                1.000                               0.552    0.545
##     m2                1.000                               0.552    0.572
##     m3                1.000                               0.552    0.615
##   wx1 =~                                                                
##     a1Sa              1.000                               0.904    0.893
##   wx2 =~                                                                
##     a2Sa              1.000                               0.902    0.893
##   wx3 =~                                                                
##     a3Sa              1.000                               0.870    0.886
##   wy1 =~                                                                
##     b1                1.000                               0.498    0.496
##   wy2 =~                                                                
##     b2                1.000                               0.536    0.523
##   wy3 =~                                                                
##     b3                1.000                               0.596    0.564
##   wz1 =~                                                                
##     m1                1.000                               0.850    0.838
##   wz2 =~                                                                
##     m2                1.000                               0.792    0.820
##   wz3 =~                                                                
##     m3                1.000                               0.708    0.788
## 
## Regressions:
##                    Estimate  Std.Err  z-value  P(>|z|)   Std.lv  Std.all
##   wx2 ~                                                                 
##     wx1               0.090    0.037    2.448    0.014    0.090    0.090
##     wy1              -0.231    0.111   -2.088    0.037   -0.128   -0.128
##     wz1               0.110    0.034    3.243    0.001    0.104    0.104
##   wy2 ~                                                                 
##     wx1              -0.032    0.026   -1.233    0.218   -0.054   -0.054
##     wy1               0.326    0.153    2.139    0.032    0.304    0.304
##     wz1               0.015    0.030    0.494    0.621    0.024    0.024
##   wz2 ~                                                                 
##     wx1               0.036    0.025    1.449    0.147    0.041    0.041
##     wy1               0.105    0.096    1.091    0.275    0.066    0.066
##     wz1               0.271    0.038    7.147    0.000    0.290    0.290
##   wx3 ~                                                                 
##     wx2               0.211    0.035    5.945    0.000    0.219    0.219
##     wy2              -0.140    0.069   -2.031    0.042   -0.086   -0.086
##     wz2               0.044    0.039    1.136    0.256    0.040    0.040
##   wy3 ~                                                                 
##     wx2              -0.016    0.022   -0.712    0.477   -0.024   -0.024
##     wy2               0.642    0.056   11.566    0.000    0.578    0.578
##     wz2              -0.015    0.027   -0.555    0.579   -0.020   -0.020
##   wz3 ~                                                                 
##     wx2              -0.003    0.027   -0.093    0.926   -0.003   -0.003
##     wy2              -0.060    0.060   -1.004    0.315   -0.045   -0.045
##     wz2               0.293    0.042    7.044    0.000    0.328    0.328
## 
## Covariances:
##                    Estimate  Std.Err  z-value  P(>|z|)   Std.lv  Std.all
##   wx1 ~~                                                                
##     wy1              -0.054    0.030   -1.770    0.077   -0.119   -0.119
##     wz1               0.084    0.026    3.283    0.001    0.110    0.110
##   wy1 ~~                                                                
##     wz1               0.011    0.028    0.384    0.701    0.025    0.025
##  .wx2 ~~                                                                
##    .wy2              -0.036    0.020   -1.765    0.078   -0.079   -0.079
##    .wz2               0.087    0.020    4.447    0.000    0.131    0.131
##  .wy2 ~~                                                                
##    .wz2              -0.002    0.018   -0.093    0.926   -0.004   -0.004
##  .wx3 ~~                                                                
##    .wy3              -0.013    0.014   -0.902    0.367   -0.032   -0.032
##    .wz3               0.013    0.018    0.709    0.478    0.022    0.022
##  .wy3 ~~                                                                
##    .wz3              -0.008    0.012   -0.640    0.522   -0.024   -0.024
##   RIx ~~                                                                
##     RIy               0.029    0.029    0.987    0.324    0.072    0.072
##     RIz               0.086    0.024    3.632    0.000    0.343    0.343
##   RIy ~~                                                                
##     RIz              -0.026    0.027   -0.955    0.340   -0.053   -0.053
## 
## Intercepts:
##                    Estimate  Std.Err  z-value  P(>|z|)   Std.lv  Std.all
##    .a1Sa              0.003    0.014    0.188    0.851    0.003    0.003
##    .a2Sa             -0.008    0.015   -0.522    0.602   -0.008   -0.008
##    .a3Sa             -0.051    0.021   -2.400    0.016   -0.051   -0.051
##    .b1               -0.021    0.015   -1.413    0.158   -0.021   -0.021
##    .b2               -0.035    0.016   -2.168    0.030   -0.035   -0.034
##    .b3               -0.095    0.021   -4.519    0.000   -0.095   -0.090
##    .m1                0.085    0.015    5.833    0.000    0.085    0.084
##    .m2               -0.048    0.014   -3.362    0.001   -0.048   -0.049
##    .m3               -0.183    0.018   -9.961    0.000   -0.183   -0.203
##     RIx               0.000                               0.000    0.000
##     RIy               0.000                               0.000    0.000
##     RIz               0.000                               0.000    0.000
##     wx1               0.000                               0.000    0.000
##    .wx2               0.000                               0.000    0.000
##    .wx3               0.000                               0.000    0.000
##     wy1               0.000                               0.000    0.000
##    .wy2               0.000                               0.000    0.000
##    .wy3               0.000                               0.000    0.000
##     wz1               0.000                               0.000    0.000
##    .wz2               0.000                               0.000    0.000
##    .wz3               0.000                               0.000    0.000
## 
## Variances:
##                    Estimate  Std.Err  z-value  P(>|z|)   Std.lv  Std.all
##     RIx               0.208    0.032    6.465    0.000    1.000    1.000
##     RIy               0.761    0.056   13.623    0.000    1.000    1.000
##     RIz               0.305    0.035    8.783    0.000    1.000    1.000
##     wx1               0.818    0.036   23.000    0.000    1.000    1.000
##     wy1               0.248    0.053    4.658    0.000    1.000    1.000
##     wz1               0.722    0.037   19.774    0.000    1.000    1.000
##    .wx2               0.782    0.032   24.615    0.000    0.961    0.961
##    .wy2               0.258    0.028    9.081    0.000    0.900    0.900
##    .wz2               0.569    0.024   23.408    0.000    0.907    0.907
##    .wx3               0.709    0.029   24.517    0.000    0.936    0.936
##    .wy3               0.235    0.012   19.247    0.000    0.662    0.662
##    .wz3               0.447    0.022   20.502    0.000    0.892    0.892
##    .a1Sa              0.000                               0.000    0.000
##    .a2Sa              0.000                               0.000    0.000
##    .a3Sa              0.000                               0.000    0.000
##    .b1                0.000                               0.000    0.000
##    .b2                0.000                               0.000    0.000
##    .b3                0.000                               0.000    0.000
##    .m1                0.000                               0.000    0.000
##    .m2                0.000                               0.000    0.000
##    .m3                0.000                               0.000    0.000
## 
## 
## Group 2 [2]:
## 
## Latent Variables:
##                    Estimate  Std.Err  z-value  P(>|z|)   Std.lv  Std.all
##   RIx =~                                                                
##     a1Sa              1.000                               0.502    0.513
##     a2Sa              1.000                               0.502    0.507
##     a3Sa              1.000                               0.502    0.499
##   RIy =~                                                                
##     b1                1.000                               0.856    0.856
##     b2                1.000                               0.856    0.853
##     b3                1.000                               0.856    0.855
##   RIz =~                                                                
##     m1                1.000                               0.511    0.531
##     m2                1.000                               0.511    0.494
##     m3                1.000                               0.511    0.484
##   wx1 =~                                                                
##     a1Sa              1.000                               0.840    0.858
##   wx2 =~                                                                
##     a2Sa              1.000                               0.853    0.862
##   wx3 =~                                                                
##     a3Sa              1.000                               0.872    0.867
##   wy1 =~                                                                
##     b1                1.000                               0.517    0.517
##   wy2 =~                                                                
##     b2                1.000                               0.525    0.523
##   wy3 =~                                                                
##     b3                1.000                               0.519    0.518
##   wz1 =~                                                                
##     m1                1.000                               0.816    0.848
##   wz2 =~                                                                
##     m2                1.000                               0.899    0.870
##   wz3 =~                                                                
##     m3                1.000                               0.924    0.875
## 
## Regressions:
##                    Estimate  Std.Err  z-value  P(>|z|)   Std.lv  Std.all
##   wx2 ~                                                                 
##     wx1               0.066    0.039    1.694    0.090    0.065    0.065
##     wy1              -0.092    0.095   -0.966    0.334   -0.056   -0.056
##     wz1               0.130    0.038    3.394    0.001    0.124    0.124
##   wy2 ~                                                                 
##     wx1              -0.044    0.027   -1.615    0.106   -0.070   -0.070
##     wy1               0.320    0.115    2.780    0.005    0.315    0.315
##     wz1               0.018    0.035    0.509    0.611    0.027    0.027
##   wz2 ~                                                                 
##     wx1               0.063    0.030    2.118    0.034    0.059    0.059
##     wy1               0.065    0.094    0.693    0.488    0.037    0.037
##     wz1               0.348    0.048    7.280    0.000    0.316    0.316
##   wx3 ~                                                                 
##     wx2               0.119    0.040    2.985    0.003    0.116    0.116
##     wy2              -0.085    0.078   -1.083    0.279   -0.051   -0.051
##     wz2               0.071    0.038    1.893    0.058    0.073    0.073
##   wy3 ~                                                                 
##     wx2              -0.027    0.025   -1.063    0.288   -0.044   -0.044
##     wy2               0.521    0.059    8.786    0.000    0.527    0.527
##     wz2               0.020    0.027    0.734    0.463    0.034    0.034
##   wz3 ~                                                                 
##     wx2              -0.021    0.033   -0.632    0.527   -0.019   -0.019
##     wy2              -0.075    0.073   -1.028    0.304   -0.043   -0.043
##     wz2               0.416    0.040   10.458    0.000    0.404    0.404
## 
## Covariances:
##                    Estimate  Std.Err  z-value  P(>|z|)   Std.lv  Std.all
##   wx1 ~~                                                                
##     wy1              -0.039    0.025   -1.555    0.120   -0.090   -0.090
##     wz1               0.071    0.027    2.608    0.009    0.104    0.104
##   wy1 ~~                                                                
##     wz1               0.008    0.031    0.246    0.806    0.018    0.018
##  .wx2 ~~                                                                
##    .wy2              -0.017    0.019   -0.908    0.364   -0.042   -0.042
##    .wz2               0.135    0.020    6.702    0.000    0.189    0.189
##  .wy2 ~~                                                                
##    .wz2               0.023    0.019    1.219    0.223    0.054    0.054
##  .wx3 ~~                                                                
##    .wy3               0.017    0.015    1.100    0.271    0.045    0.045
##    .wz3               0.078    0.021    3.622    0.000    0.107    0.107
##  .wy3 ~~                                                                
##    .wz3              -0.025    0.014   -1.702    0.089   -0.066   -0.066
##   RIx ~~                                                                
##     RIy               0.003    0.025    0.125    0.900    0.007    0.007
##     RIz               0.102    0.026    3.916    0.000    0.396    0.396
##   RIy ~~                                                                
##     RIz              -0.023    0.031   -0.750    0.454   -0.053   -0.053
## 
## Intercepts:
##                    Estimate  Std.Err  z-value  P(>|z|)   Std.lv  Std.all
##    .a1Sa             -0.003    0.015   -0.239    0.811   -0.003   -0.004
##    .a2Sa              0.016    0.015    1.055    0.291    0.016    0.016
##    .a3Sa              0.073    0.023    3.215    0.001    0.073    0.073
##    .b1                0.003    0.016    0.171    0.864    0.003    0.003
##    .b2               -0.015    0.017   -0.880    0.379   -0.015   -0.015
##    .b3               -0.012    0.021   -0.594    0.553   -0.012   -0.012
##    .m1               -0.095    0.015   -6.534    0.000   -0.095   -0.099
##    .m2                0.064    0.016    3.986    0.000    0.064    0.061
##    .m3                0.244    0.023   10.711    0.000    0.244    0.231
##     RIx               0.000                               0.000    0.000
##     RIy               0.000                               0.000    0.000
##     RIz               0.000                               0.000    0.000
##     wx1               0.000                               0.000    0.000
##    .wx2               0.000                               0.000    0.000
##    .wx3               0.000                               0.000    0.000
##     wy1               0.000                               0.000    0.000
##    .wy2               0.000                               0.000    0.000
##    .wy3               0.000                               0.000    0.000
##     wz1               0.000                               0.000    0.000
##    .wz2               0.000                               0.000    0.000
##    .wz3               0.000                               0.000    0.000
## 
## Variances:
##                    Estimate  Std.Err  z-value  P(>|z|)   Std.lv  Std.all
##     RIx               0.252    0.029    8.836    0.000    1.000    1.000
##     RIy               0.733    0.044   16.488    0.000    1.000    1.000
##     RIz               0.261    0.045    5.772    0.000    1.000    1.000
##     wx1               0.706    0.032   22.340    0.000    1.000    1.000
##     wy1               0.267    0.041    6.474    0.000    1.000    1.000
##     wz1               0.665    0.047   14.259    0.000    1.000    1.000
##    .wx2               0.710    0.030   23.601    0.000    0.975    0.975
##    .wy2               0.246    0.025    9.892    0.000    0.891    0.891
##    .wz2               0.721    0.027   27.172    0.000    0.891    0.891
##    .wx3               0.741    0.032   23.443    0.000    0.974    0.974
##    .wy3               0.192    0.013   15.350    0.000    0.714    0.714
##    .wz3               0.717    0.029   25.040    0.000    0.840    0.840
##    .a1Sa              0.000                               0.000    0.000
##    .a2Sa              0.000                               0.000    0.000
##    .a3Sa              0.000                               0.000    0.000
##    .b1                0.000                               0.000    0.000
##    .b2                0.000                               0.000    0.000
##    .b3                0.000                               0.000    0.000
##    .m1                0.000                               0.000    0.000
##    .m2                0.000                               0.000    0.000
##    .m3                0.000                               0.000    0.000
fitMeasures(RICLPM_Safety_fit_Sex, fit.measures = c("chisq","df","pvalue","rmsea","srmr","cfi"))
##  chisq     df pvalue  rmsea   srmr    cfi 
## 12.365  6.000  0.054  0.015  0.007  1.000

Global differences - Constrained lagged-parameters for multi-groups

Multigroup Peers

MG_Safety <- '
  RIx =~ 1*a1Sa + 1*a2Sa + 1*a3Sa
  RIy =~ 1*b1 + 1*b2 + 1*b3
  RIz =~ 1*m1 + 1*m2 + 1*m3
  
  wx1 =~ 1*a1Sa
  wx2 =~ 1*a2Sa
  wx3 =~ 1*a3Sa
  wy1 =~ 1*b1
  wy2 =~ 1*b2
  wy3 =~ 1*b3
  wz1 =~ 1*m1
  wz2 =~ 1*m2
  wz3 =~ 1*m3
  
  # Estimate lagged effects between within-person centered variables (constrain   
  # autoregressive effects across groups) 
  wx2 ~ c(a1, a1)*wx1 + c(b1, b1)*wy1 + c(c1, c1)*wz1
  wy2 ~ c(d1, d1)*wx1 + c(e1, e1)*wy1 + c(f1, f1)*wz1
  wz2 ~ c(g1, g1)*wx1 + c(h1, h1)*wy1 + c(i1, i1)*wz1

  wx3 ~ c(a2, a2)*wx2 + c(b2, b2)*wy2 + c(c2, c2)*wz2
  wy3 ~ c(d2, d2)*wx2 + c(e2, e2)*wy2 + c(f2, f2)*wz2
  wz3 ~ c(g2, g2)*wx2 + c(h2, h2)*wy2 + c(i2, i2)*wz2  

  wx1 ~~ wy1
  wx1 ~~ wz1
  wy1 ~~ wz1
  
  wx2 ~~ wy2 
  wx2 ~~ wz2
  wy2 ~~ wz2
  wx3 ~~ wy3
  wx3 ~~ wz3
  wy3 ~~ wz3
  
  RIx ~~ RIx
  RIy ~~ RIy
  RIz ~~ RIz
  RIx ~~ RIy
  RIx ~~ RIz
  RIy ~~ RIz

  wx1 ~~ wx1
  wy1 ~~ wy1
  wz1 ~~ wz1
  wx2 ~~ wx2
  wy2 ~~ wy2
  wz2 ~~ wz2
  wx3 ~~ wx3
  wy3 ~~ wy3
  wz3 ~~ wz3'
  
MG_Safety_Peers_fit <- lavaan(MG_Safety, 
                              data = Data,
                              missing = 'fiml', 
                              meanstructure = TRUE, 
                              int.ov.free = TRUE,
                              group = "Resilience_Peers"
)
## Warning in lav_data_full(data = data, group = group, cluster = cluster, : lavaan WARNING: group variable 'Resilience_Peers' contains missing values
anova(RICLPM_Safety_fit_Peers, MG_Safety_Peers_fit)
## 
## Chi-Squared Difference Test
## 
##                         Df    AIC    BIC  Chisq Chisq diff     RMSEA Df diff Pr(>Chisq)
## RICLPM_Safety_fit_Peers  6 154588 155318 15.217                                        
## MG_Safety_Peers_fit     24 154577 155178 40.070     24.852 0.0089633      18      0.129

Multigroup Gender

MG_Safety_Sex_fit <- lavaan(MG_Safety, 
                              data = Data,
                              missing = 'fiml', 
                              meanstructure = TRUE, 
                              int.ov.free = TRUE,
                              group = "Sex"
)
## Warning in lav_data_full(data = data, group = group, cluster = cluster, : lavaan WARNING: group variable 'Sex' contains missing values
## Warning in lav_data_full(data = data, group = group, cluster = cluster, : lavaan WARNING: some cases are empty and will be ignored:
##   4760 9337
anova(RICLPM_Safety_fit_Sex, MG_Safety_Sex_fit)
## 
## Chi-Squared Difference Test
## 
##                       Df    AIC    BIC  Chisq Chisq diff RMSEA Df diff Pr(>Chisq)
## RICLPM_Safety_fit_Sex  6 154011 154741 12.366                                    
## MG_Safety_Sex_fit     24 153993 154594 29.940     17.575     0      18      0.484

Neighbourhood safety - Main model - Parents

Neighbourhood safety x brain connectivity x youth problems

RICLPM_Safety_Parent <- '
# Create between components (random intercepts)
RIx =~ 1*a1SaPa + 1*a2SaPa + 1*a3SaPa
RIy =~ 1*b1 + 1*b2 + 1*b3
RIz =~ 1*m1 + 1*m2 + 1*m3

# Create within-person centered variables
wx1 =~ 1*a1SaPa
wx2 =~ 1*a2SaPa
wx3 =~ 1*a3SaPa
wy1 =~ 1*b1
wy2 =~ 1*b2
wy3 =~ 1*b3
wz1 =~ 1*m1
wz2 =~ 1*m2
wz3 =~ 1*m3

# Estimate lagged effects between within-person centered variables
wx2 + wy2 + wz2 ~ wx1 + wy1 + wz1
wx3 + wy3 + wz3 ~ wx2 + wy2 + wz2

# Estimate covariance between within-person centered variables at first wave
wx1 ~~ wy1 # Covariance
wx1 ~~ wz1
wy1 ~~ wz1

# Estimate covariances between residuals of within-person centered variables 
# (i.e., innovations)
wx2 ~~ wy2
wx2 ~~ wz2
wy2 ~~ wz2
wx3 ~~ wy3
wx3 ~~ wz3
wy3 ~~ wz3

# Estimate variance and covariance of random intercepts
RIx ~~ RIx
RIy ~~ RIy
RIz ~~ RIz
RIx ~~ RIy
RIx ~~ RIz
RIy ~~ RIz

# Estimate (residual) variance of within-person centered variables
wx1 ~~ wx1 # Variances
wy1 ~~ wy1
wz1 ~~ wz1
wx2 ~~ wx2 # Residual variances
wy2 ~~ wy2
wz2 ~~ wz2
wx3 ~~ wx3
wy3 ~~ wy3
wz3 ~~ wz3
'

RICLPM_Safety_Parent_fit <- lavaan::lavaan(RICLPM_Safety_Parent,
                                    data = Data,
                                    missing = "fiml",
                                    meanstructure = TRUE, 
                                    int.ov.free = TRUE)

summary(RICLPM_Safety_Parent_fit, standardized = TRUE)
## lavaan 0.6.16 ended normally after 87 iterations
## 
##   Estimator                                         ML
##   Optimization method                           NLMINB
##   Number of model parameters                        51
## 
##                                                   Used       Total
##   Number of observations                          9493        9495
##   Number of missing patterns                        85            
## 
## Model Test User Model:
##                                                       
##   Test statistic                                18.998
##   Degrees of freedom                                 3
##   P-value (Chi-square)                           0.000
## 
## Parameter Estimates:
## 
##   Standard errors                             Standard
##   Information                                 Observed
##   Observed information based on                Hessian
## 
## Latent Variables:
##                    Estimate  Std.Err  z-value  P(>|z|)   Std.lv  Std.all
##   RIx =~                                                                
##     a1SaPa            1.000                               0.713    0.712
##     a2SaPa            1.000                               0.713    0.707
##     a3SaPa            1.000                               0.713    0.703
##   RIy =~                                                                
##     b1                1.000                               0.864    0.862
##     b2                1.000                               0.864    0.852
##     b3                1.000                               0.864    0.839
##   RIz =~                                                                
##     m1                1.000                               0.500    0.503
##     m2                1.000                               0.500    0.499
##     m3                1.000                               0.500    0.499
##   wx1 =~                                                                
##     a1SaPa            1.000                               0.703    0.702
##   wx2 =~                                                                
##     a2SaPa            1.000                               0.713    0.707
##   wx3 =~                                                                
##     a3SaPa            1.000                               0.721    0.711
##   wy1 =~                                                                
##     b1                1.000                               0.508    0.507
##   wy2 =~                                                                
##     b2                1.000                               0.532    0.524
##   wy3 =~                                                                
##     b3                1.000                               0.560    0.544
##   wz1 =~                                                                
##     m1                1.000                               0.859    0.864
##   wz2 =~                                                                
##     m2                1.000                               0.868    0.867
##   wz3 =~                                                                
##     m3                1.000                               0.868    0.867
## 
## Regressions:
##                    Estimate  Std.Err  z-value  P(>|z|)   Std.lv  Std.all
##   wx2 ~                                                                 
##     wx1               0.178    0.034    5.256    0.000    0.175    0.175
##     wy1              -0.025    0.060   -0.411    0.681   -0.018   -0.018
##     wz1               0.022    0.021    1.034    0.301    0.027    0.027
##   wy2 ~                                                                 
##     wx1              -0.048    0.029   -1.664    0.096   -0.063   -0.063
##     wy1               0.328    0.092    3.569    0.000    0.314    0.314
##     wz1               0.018    0.023    0.785    0.433    0.030    0.030
##   wz2 ~                                                                 
##     wx1              -0.017    0.031   -0.540    0.589   -0.014   -0.014
##     wy1               0.090    0.071    1.275    0.202    0.053    0.053
##     wz1               0.335    0.032   10.521    0.000    0.331    0.331
##   wx3 ~                                                                 
##     wx2               0.176    0.031    5.682    0.000    0.175    0.175
##     wy2               0.020    0.049    0.404    0.686    0.015    0.015
##     wz2               0.027    0.025    1.058    0.290    0.032    0.032
##   wy3 ~                                                                 
##     wx2               0.009    0.023    0.385    0.700    0.011    0.011
##     wy2               0.584    0.040   14.422    0.000    0.554    0.554
##     wz2               0.008    0.019    0.406    0.685    0.012    0.012
##   wz3 ~                                                                 
##     wx2              -0.034    0.028   -1.214    0.225   -0.028   -0.028
##     wy2              -0.066    0.048   -1.392    0.164   -0.041   -0.041
##     wz2               0.402    0.029   13.850    0.000    0.402    0.402
## 
## Covariances:
##                    Estimate  Std.Err  z-value  P(>|z|)   Std.lv  Std.all
##   wx1 ~~                                                                
##     wy1              -0.028    0.017   -1.641    0.101   -0.078   -0.078
##     wz1               0.034    0.018    1.911    0.056    0.057    0.057
##   wy1 ~~                                                                
##     wz1               0.014    0.023    0.607    0.544    0.032    0.032
##  .wx2 ~~                                                                
##    .wy2              -0.014    0.012   -1.085    0.278   -0.038   -0.038
##    .wz2              -0.001    0.013   -0.075    0.940   -0.002   -0.002
##  .wy2 ~~                                                                
##    .wz2               0.010    0.013    0.738    0.461    0.024    0.024
##  .wx3 ~~                                                                
##    .wy3               0.006    0.010    0.675    0.500    0.020    0.020
##    .wz3              -0.020    0.012   -1.629    0.103   -0.036   -0.036
##  .wy3 ~~                                                                
##    .wz3              -0.006    0.010   -0.569    0.569   -0.015   -0.015
##   RIx ~~                                                                
##     RIy              -0.003    0.018   -0.188    0.851   -0.005   -0.005
##     RIz               0.068    0.018    3.791    0.000    0.190    0.190
##   RIy ~~                                                                
##     RIz              -0.030    0.023   -1.309    0.191   -0.069   -0.069
## 
## Intercepts:
##                    Estimate  Std.Err  z-value  P(>|z|)   Std.lv  Std.all
##    .a1SaPa            0.002    0.010    0.147    0.883    0.002    0.002
##    .a2SaPa            0.011    0.011    1.021    0.307    0.011    0.011
##    .a3SaPa            0.034    0.015    2.296    0.022    0.034    0.033
##    .b1               -0.010    0.011   -0.909    0.363   -0.010   -0.010
##    .b2               -0.026    0.012   -2.259    0.024   -0.026   -0.026
##    .b3               -0.055    0.015   -3.699    0.000   -0.055   -0.053
##    .m1                0.000    0.010    0.012    0.990    0.000    0.000
##    .m2                0.005    0.011    0.495    0.621    0.005    0.005
##    .m3                0.021    0.015    1.430    0.153    0.021    0.021
##     RIx               0.000                               0.000    0.000
##     RIy               0.000                               0.000    0.000
##     RIz               0.000                               0.000    0.000
##     wx1               0.000                               0.000    0.000
##    .wx2               0.000                               0.000    0.000
##    .wx3               0.000                               0.000    0.000
##     wy1               0.000                               0.000    0.000
##    .wy2               0.000                               0.000    0.000
##    .wy3               0.000                               0.000    0.000
##     wz1               0.000                               0.000    0.000
##    .wz2               0.000                               0.000    0.000
##    .wz3               0.000                               0.000    0.000
## 
## Variances:
##                    Estimate  Std.Err  z-value  P(>|z|)   Std.lv  Std.all
##     RIx               0.509    0.020   25.412    0.000    1.000    1.000
##     RIy               0.746    0.035   21.597    0.000    1.000    1.000
##     RIz               0.250    0.032    7.715    0.000    1.000    1.000
##     wx1               0.494    0.020   25.293    0.000    1.000    1.000
##     wy1               0.258    0.033    7.922    0.000    1.000    1.000
##     wz1               0.738    0.034   21.977    0.000    1.000    1.000
##    .wx2               0.492    0.017   28.276    0.000    0.967    0.967
##    .wy2               0.253    0.018   13.728    0.000    0.893    0.893
##    .wz2               0.669    0.019   34.953    0.000    0.887    0.887
##    .wx3               0.503    0.017   29.931    0.000    0.968    0.968
##    .wy3               0.217    0.009   24.522    0.000    0.692    0.692
##    .wz3               0.631    0.019   33.998    0.000    0.838    0.838
##    .a1SaPa            0.000                               0.000    0.000
##    .a2SaPa            0.000                               0.000    0.000
##    .a3SaPa            0.000                               0.000    0.000
##    .b1                0.000                               0.000    0.000
##    .b2                0.000                               0.000    0.000
##    .b3                0.000                               0.000    0.000
##    .m1                0.000                               0.000    0.000
##    .m2                0.000                               0.000    0.000
##    .m3                0.000                               0.000    0.000
fitMeasures(RICLPM_Safety_Parent_fit, fit.measures = c("chisq","df","pvalue","rmsea","srmr","cfi"))
##  chisq     df pvalue  rmsea   srmr    cfi 
## 18.998  3.000  0.000  0.024  0.009  0.999
 

Ayla Pollmann - 2024